

The annual voter registration report released by the State Election Board last week shows an increase in voter registration for all political parties except one. The Oklahoma Democratic Party is the only one that has shrunk since the last report, according to the data on the state’s website.
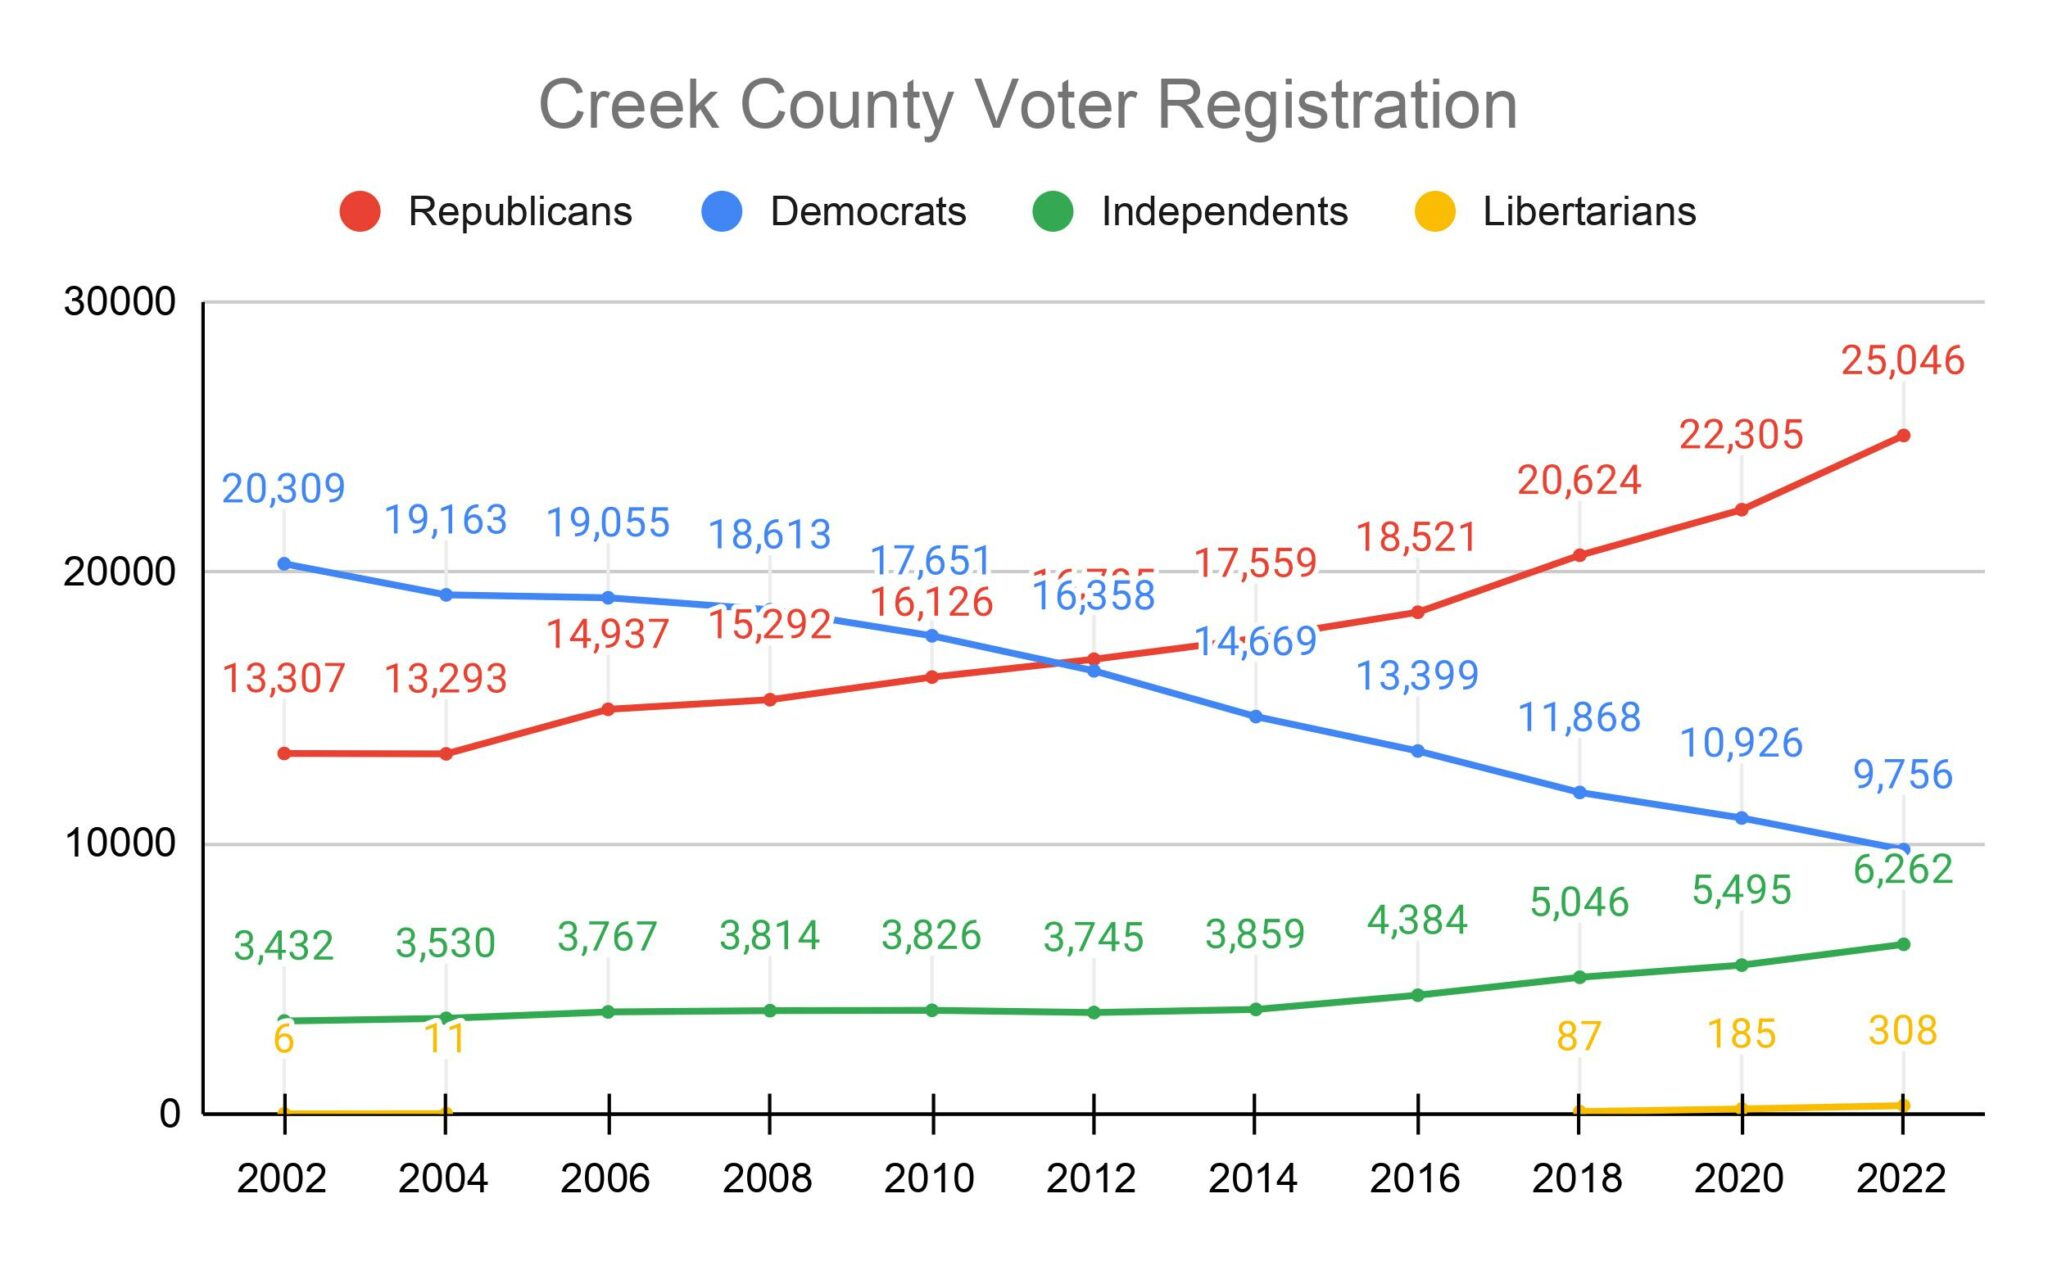
Creek County numbers echo those same trends. In 2020, Republicans made up 22,305 of the voters, with Democrats bringing in 10,926. By 2022, Republicans had risen to 25,046, while the Democratic party fell to 9,756—dipping beneath 10,000 for the first time in recorded state history.
Until the late 1950s, there were no central voter registration records in each county, according to oklahoma.gov. The first statewide voter registration report was compiled in 1960. From 1960 until 1995, only statewide voter registration was reported.

Today, the State Election Board reports voter registration statistics by county and political affiliation on January 15 and November 1 of each year. For these reports, the state only measures even-numbered years, and even then only measures the January count.
Misha Moor, the Public Information Officer for the State Election Board, gives an explanation of why these comparisons happen every two years, instead of every year:
“We compared 2022 to 2020 because that provides a more ‘apples-to-apples’ comparison,” she says. “Every odd-numbered year, the State Election Board conducts statutorily-required voter registration maintenance to remove “inactive” voters, which creates a sudden drop in registration mid-year. Additionally, even-numbered years are general election years, so it is common to see an overall increase in numbers due to the number of elections those years.”
A look at the last 20 years of voter registration in Creek County shows a steady decline in registered Democrats since 2012 when Republicans became the dominant party in the county.
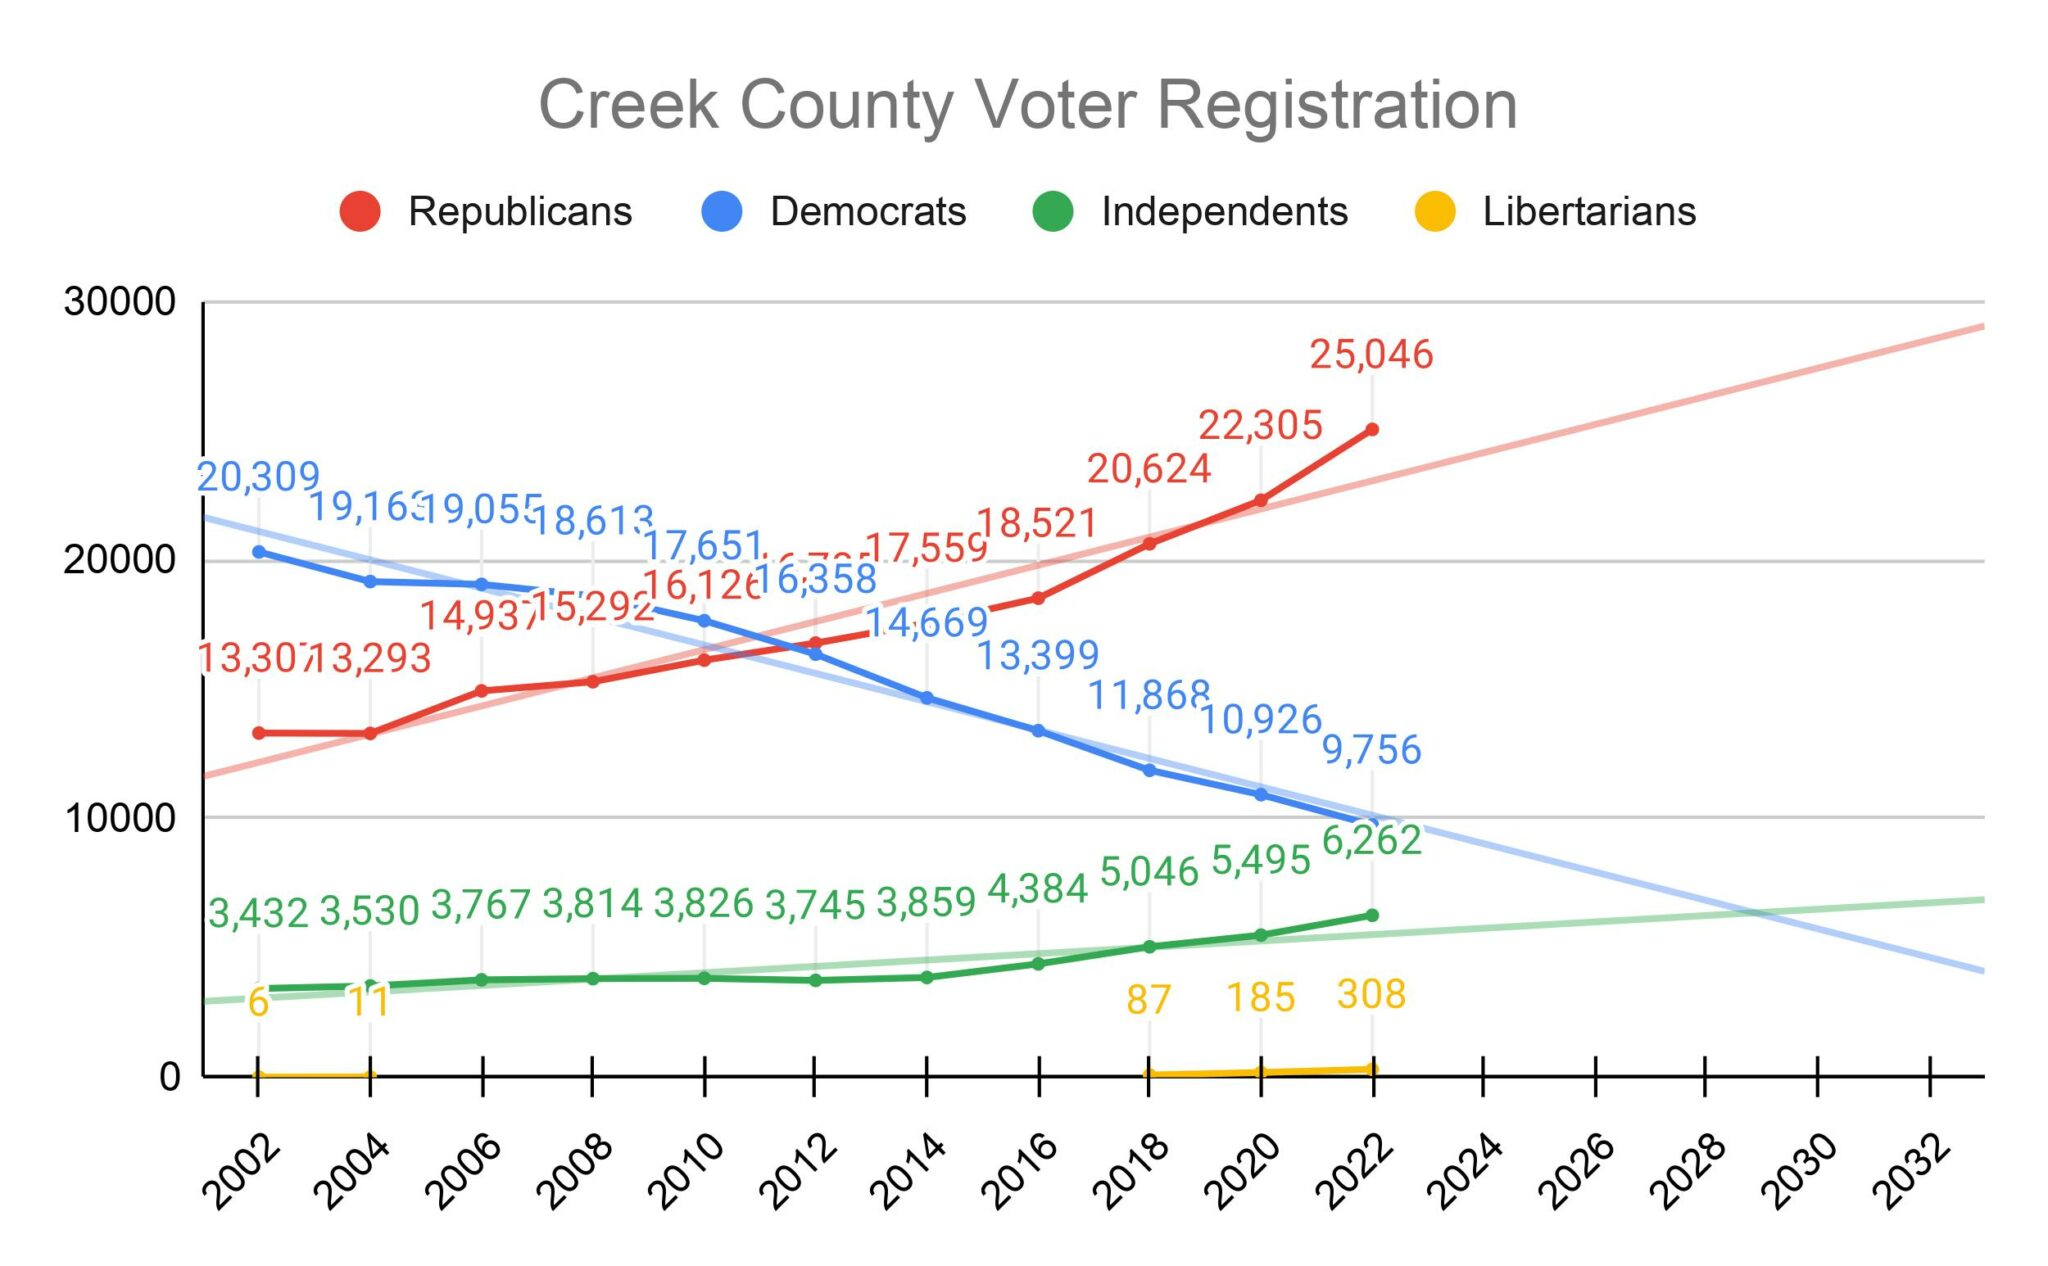
If the current trend of the last 20 years continues, it’s possible that the Independent Party will overtake the Democratic Party by 2030.
At the state level, both the Libertarian Party (which gained recognition in 2016) and Independent voters have seen steady growth for the past two years. Libertarians account for less than 1% of Oklahoma voters and Independents (those with no party affiliation) round out the total with 17.2% of registered voters.
Sapulpa has an important election coming up on February 8th, to extend the two-cent sales tax. If you live in Ward 2, there’s also an election for Seat One between incumbent Carla Gunn and two others.
For more information on voter registration or to view historical voter registration statistics, visit the state website at oklahoma.gov/elections