This story originally appeared in the Sapulpa Times 08/30/2020 Print Edition.
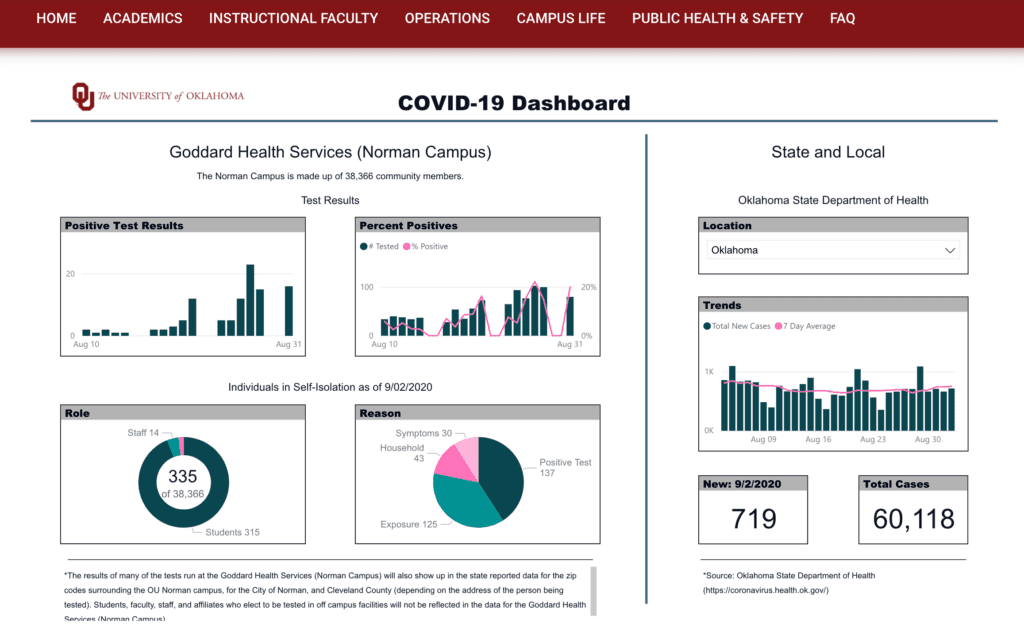
On Friday, August 28th the University of Oklahoma released its COVID-19 Dashboard, which will provide COVID-19 statistics at the University. Data on community members in isolation housing, the reason for isolation, the percent of positive tests, and Cleveland County, Norman and statewide data will all be accessible on the dashboard.
The dashboard states that students, faculty, and staff who choose to have their tests done off-campus in Cleveland County will not be represented in the Goddard Health Services data, but will appear in the data provided to Cleveland County, Norman, and the state of Oklahoma.
All tests performed by Goddard Health Services will be available on the university dashboard, regardless of the address provided.
OU spokesperson, Kesha Keith, said that the dashboard will be updated daily with the positive PCR COVID-19 test results from Goddard Health Center, self-reported positive PCR results submitted to Goddard, and Cleveland County and regional area statistics.
The University will not track or conduct rapid antigen tests since The Oklahoma State Department of Health lists those results as probable cases instead of confirmed cases.

Goddard health says that students should give a local address to ensure the information goes directly to the student. According to Keith, isolation housing numbers are not being tracked since most students are expected to isolate off-campus. She said that there are 300 rooms available for students to isolate on campus and that local hotels rooms will be utilized if the need arises.
41 positive cases were recorded between August 10th and August 25th.
Currently, there are 135 OU community members, of which 109 are students, in self-isolation.
Here is the link to the OU dashboard: ou.edu/together/dashboard
Six feet of social Distancing may not be enough
Public health officials are reassessing the six-foot protocol for social distancing to help prevent the spread of COVID-19. A recent study published in the British Medical Journal by a team of infectious disease experts argue that the six-foot rule is based on outdated science. The six-foot separation standard originated from research by a German biologist, Carl Flügge, who in the late 1800s postulated that droplets containing pathogens could travel 1-2 meters. He based this on visible droplets collected on glass. What he did not know was that many particles that are invisible to the naked eye, known as aerosols, can travel much further. Subsequent studies utilizing improved photography reinforced the scientific basis for this rule.
Recent studies using modern techniques have shown that the aerosols produced by a sneeze can travel up to 8 meters.
There are myriad mitigating factors such as air circulation, ventilation, exposure time, crowd density, and whether or not people are wearing masks, and if those individuals are speaking or not speaking, shouting, singing, coughing or sneezing.
Linsey Marr, a Virginia Tech civil and environmental engineering professor, who has studied airborne viruses but was not involved with the BMJ study, said, “I think six feet is a fine number, but we need to convey that this is a starting point. Beyond six feet doesn’t mean there’s zero risk.” An appropriate analogy would be a cigarette smoker’s cloud. The further away you are from the smoker the less exposure you have to the smoke because of dilution.
University of Colorado aerosol expert Jose-Luis Jimenez said, “Distance alone will never solve the aerosol problem. If you are in the same room, you can get infected. [Being] outdoors, distanced, with well-fitted masks is the only thing close to a silver bullet.”


